There is a quiet revolution happening in how museums engage their visitors. Most public gardens are still thirty years behind it. The question this article asks is simple: what does the research actually say about turning a one-time visitor into a returning one — and what should garden managers do about it?
The answer turns on a single distinction. A static label tells you what a plant is called. An interactive label tells you why it matters. Decades of museum and attraction research show why that distinction is not cosmetic. It predicts whether visitors come back.
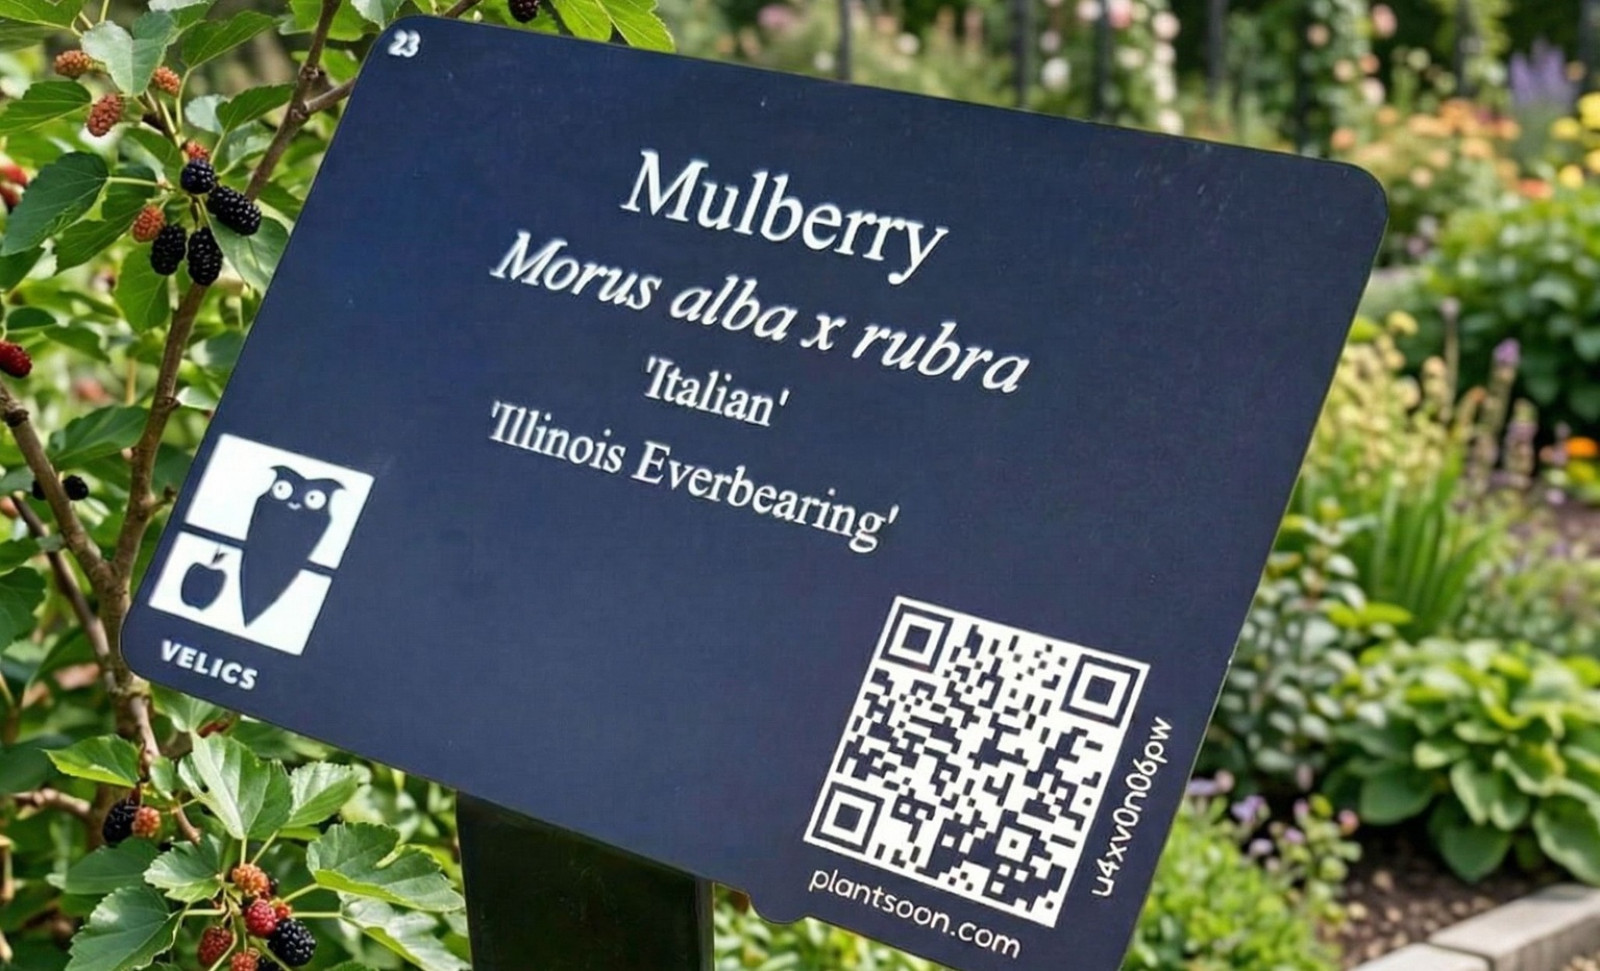
Static signs ask the visitor to compromise. Layered signs let the visitor choose.
What the evidence shows
Four peer-reviewed studies, taken together, build a foundation that holds. None of them is specifically about plant labels in public gardens. All four are about the underlying mechanism — how interactive interpretation affects visitor engagement, satisfaction, and the willingness to return.
Interactive technology raises satisfaction
A 2025 study at the Science Museum in Addis Ababa applied structural equation modelling to data from 189 museum visitors. The result was unambiguous: interactive technology had a significant positive effect on perceived authenticity, visitor engagement, the overall visitor experience, and satisfaction. Authenticity and engagement turned out to be strong predictors of eventual satisfaction.
This matters for green spaces because, in the broader attraction and hospitality literature, satisfaction is the most reliable predictor of repeat visitation. What raises satisfaction raises return visits. The chain is not theoretical — it is repeatedly measured.
Storytelling deepens connection
The EMOTIVE project at the Hunterian Museum in Glasgow tackled a problem familiar to anyone who manages a garden: how do you make seemingly static objects come alive? Their answer was character-driven digital storytelling around fragmentary archaeological finds. The 2025 evaluation produced empirically validated design principles and showed that narrative — especially with characters and emotional arcs — strengthens the connection between visitor and object.
Translate that to a botanical context. A plant becomes memorable when it has a story. A QR code that displays only a Latin name is a search engine result. A QR code that tells the plant's story — origin, use, anecdote, seasonal change — is an experience.
Visitors barely look at static signs
A 2024 eye-tracking study at six cultural venues in Nottingham, with fifty-one participants, gave us the most uncomfortable number in the dataset. Average fixation on individual signs ranged from 1.44 to 14.12 seconds. Some signs caught the eye for only 0.22 seconds — barely longer than the blink that followed.
What can a visitor learn in 1.4 seconds? Almost nothing in words. Just enough to register a shape, an image, perhaps a single bold phrase. If your sign opens with a Latin name and a paragraph of taxonomic description, the visitor's eye has already moved on.
Wayfinding encourages exploration
Closer to the practice of public green spaces: the 2023 Delapré Walk Project installed wayfinding signage with QR codes along walking routes in an English urban park. Surveys among 266 visitors showed that wayfinding significantly raised confidence to explore, sense of safety, and motivation to walk further.
The mechanism is small but consequential. Interactive elements lower the threshold to move deeper into a green space. Visitors who walk further see more. Visitors who see more remember more. Visitors who remember more come back.
The keystone insight
Pull these four findings together and a pattern emerges. Interactive interpretation does not just make a visit nicer. It changes the visit's structure.
A traditional plant label is a documentation tool. It records what the plant is, for visitors who already know what to do with that information. For everyone else — which is almost everyone — it is part of the scenery.
An interactive plant label is a different kind of object. Its job is not to identify the plant. Its job is to make the visitor notice the plant. Identification follows attention; attention does not follow identification.
The unsolvable tension — and how to resolve it
For decades, garden-signage designers have wrestled with a tension that seems unsolvable. Visitors want short, inviting content that respects their walking pace. Botanists, conservators, and educators want comprehensive, accurate information that respects the science. Both groups are right. Both deserve to be served.
Static signage cannot satisfy both. Make the sign short, and the science is lost. Make it comprehensive, and the visitor is lost. For most of the twentieth century, gardens defaulted toward the science and accepted that the visitor would skim.
A label with a QR code resolves the tension by separating the surface from the depth. The physical surface — what the visitor sees in 1.4 seconds — can be short, inviting, beautiful, brief. The digital depth — what waits behind the scan — can hold the full story, the taxonomy, the seasonal photographs, the conservation context, the audio for visually impaired visitors, the translation into multiple languages.
The casual passer-by gets the surface. The curious visitor scans for the depth. Neither is forced to compromise.
How to measure this in your own garden
Theory is one thing. Evidence in your own space is more convincing — and more useful. The framework below makes the impact of interactive labels measurable without an academic setup.
Four metrics matter most. The scan rate per location tells you how compelling your physical labels are. Time spent on the digital page tells you how engaging the content behind the scan is. Scans per visit indicates depth of engagement — visitors who scan multiple labels are exploring deliberately. The return rate, ideally measured at thirty and ninety days, is your core indicator of repeat visitation.
Three simple experiments turn those metrics into evidence. A before/after measurement — three months of visitor counts and interactions before installation, three after — is rough but compelling. A/B zoning, with interactive labels in one part of the garden and static labels in another, isolates the effect of the label format itself. A short intercept survey as the final digital page can ask one question — "How likely are you to come back?" — and produce a Net Promoter Score-style measurement in two taps.
None of this requires a research grant. It requires analytics that interactive labels collect by default, a willingness to track for a quarter, and the curiosity to compare.
What this means for your green space
If you manage a botanical garden, an arboretum, a school garden, or a public park, the implication is direct. Your visitors are not failing to engage because they are uninterested. They are failing because the format you have given them does not match how human attention works in 2026.
The fix is not to write better static signs. Static signage has a ceiling that better writing cannot break through. The ceiling is human attention itself, and it caps out at a few seconds for any single object. The only way to deliver more without violating that limit is to layer.
Make the physical label short and arresting — one image, one phrase, one invitation. Make the digital layer behind the QR code generous, layered, and rich. Let the visitor choose. Most will glance and walk on. Some will stop and scan. Both groups will leave with a better experience than your current sign provides to either.
A 1.4-second glance is not wasted. It just has to be designed for what it is: the start of a story, not the entire telling.
Sources
- (2025). The effect of interactive technology on enriching visitor experiences: Evidence from the science museum, Addis Ababa, Ethiopia . International Journal of Information Management Data Insights
- (2025). Digital storytelling for emotional engagement in museums: design and evaluation of the Hunterian Antonine Wall EMOTIVE experiences . International Journal of Heritage Studies
- (2024). Using Eye-Tracking to Create Impactful Interpretation Signage for Botanic Gardens and Other Visitor Attractions . Journal of Zoological and Botanical Gardens
- (2023). Are signposted walking routes an effective intervention to increase engagement in urban parks? A natural experimental study . Urban park engagement research